Volatility Arbitrage
For options sellers. To find and manage better trades. Grounded in real market data.
Screen · Analyze · Manage risk
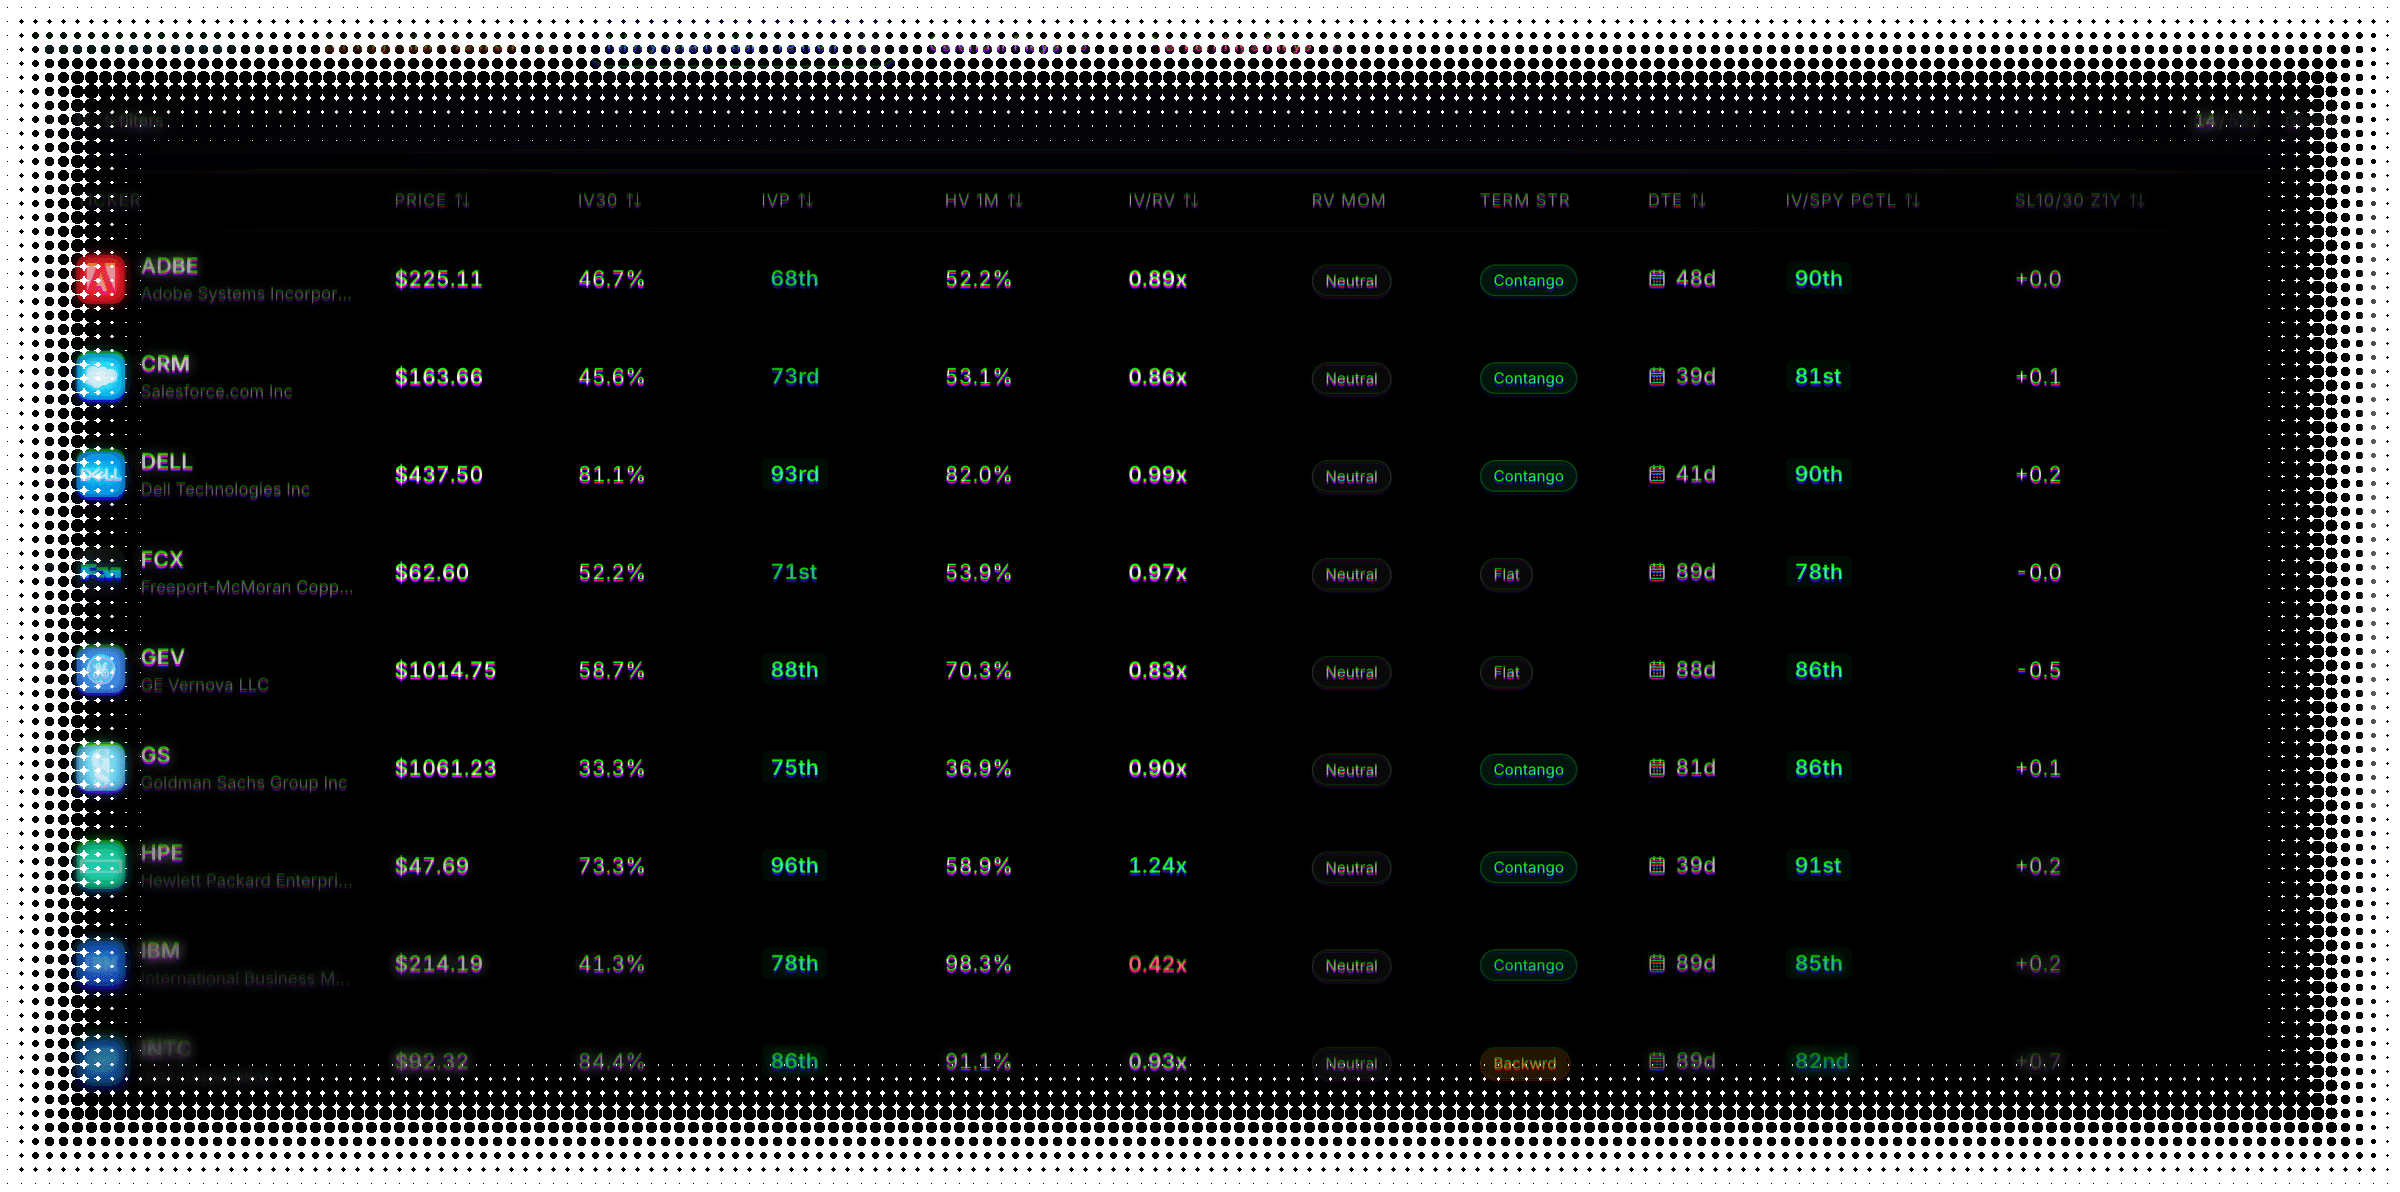
Tools for screening, analyzing, and managing options trades
Screen for risk premium setups, validate the edge, and trade with more structure.
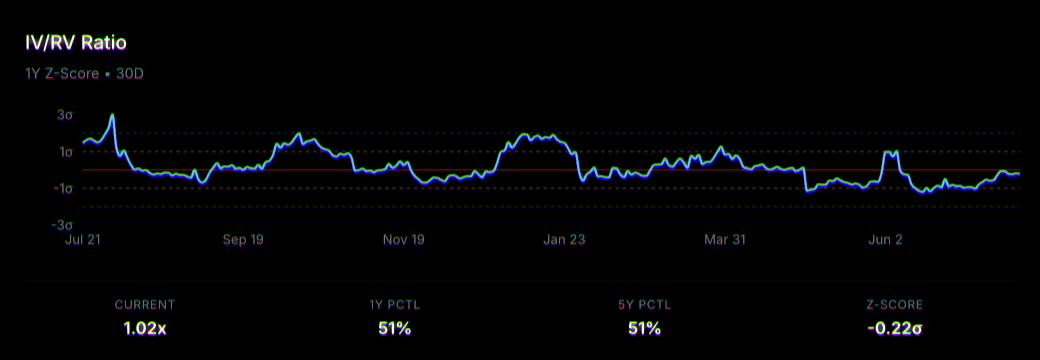
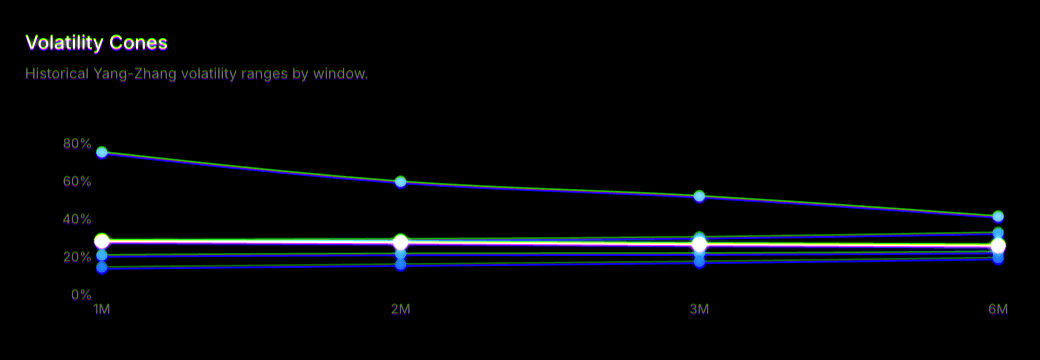
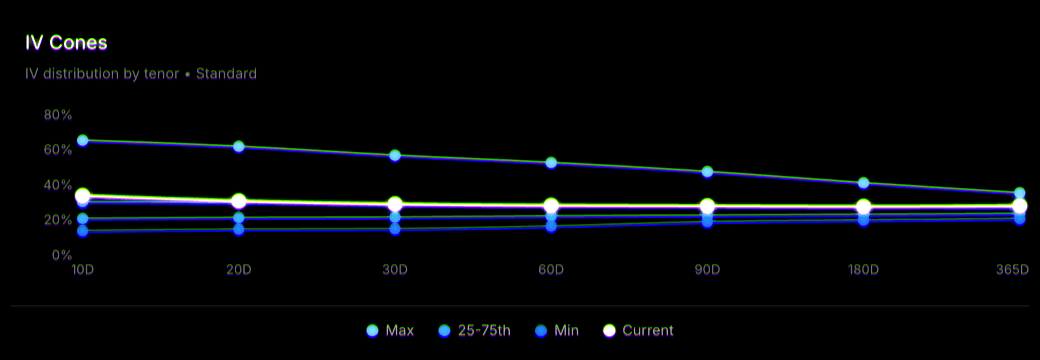
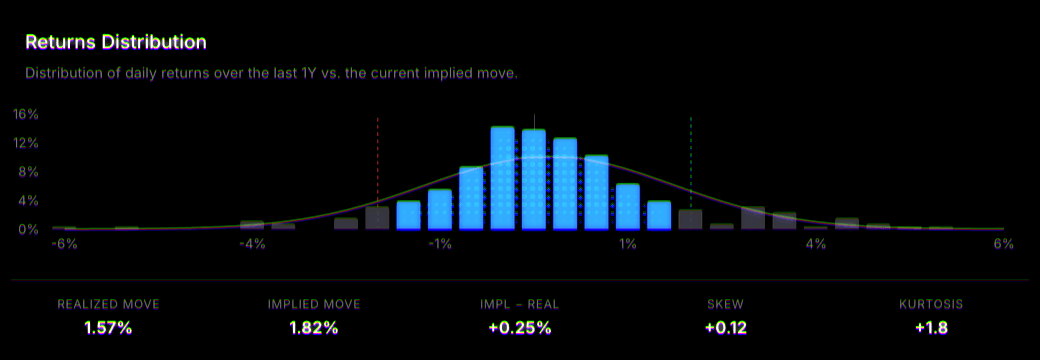
Every angle of volatility, charted
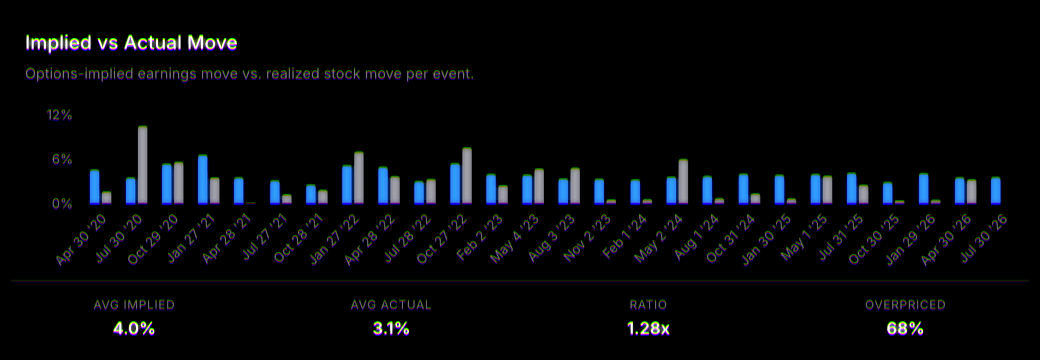
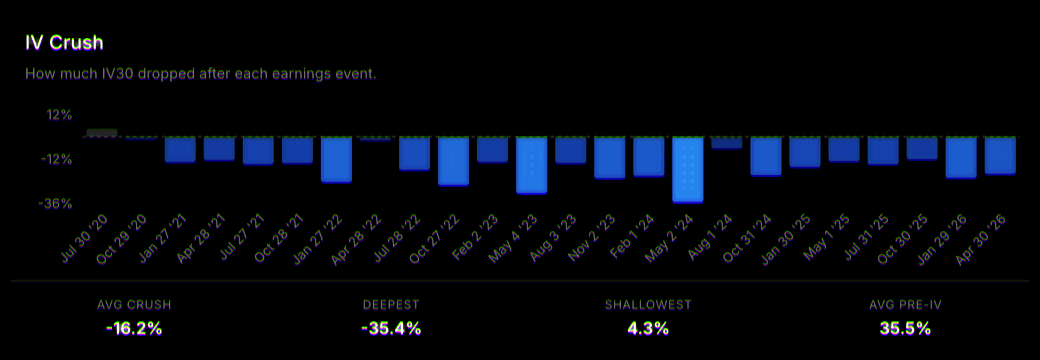
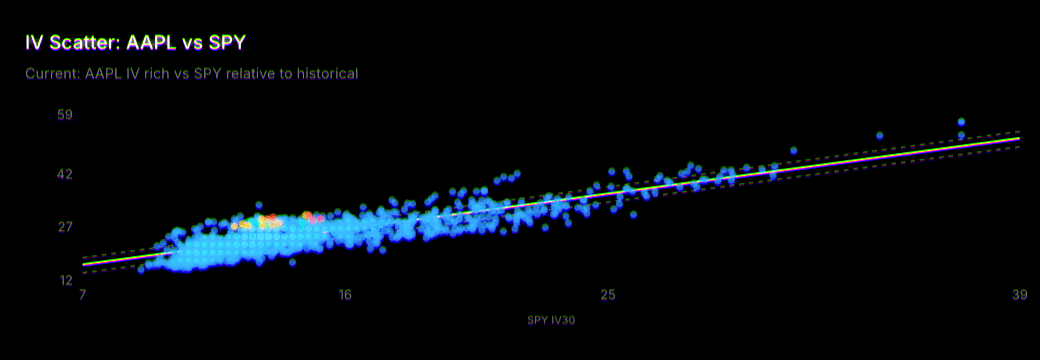
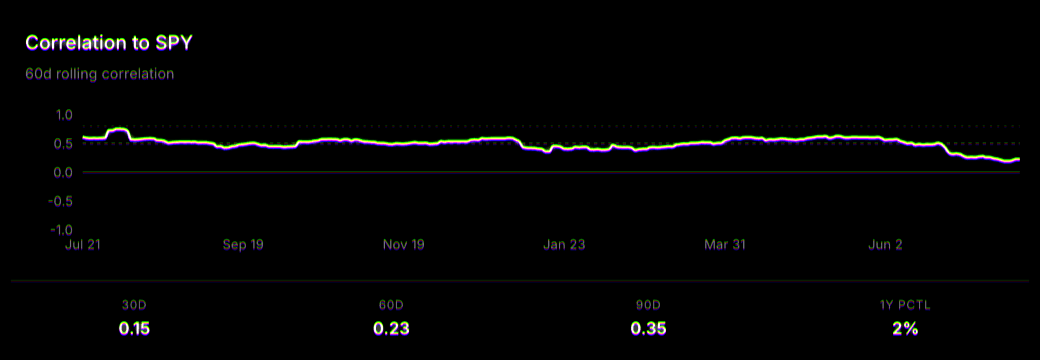
Skew, term structure, IV vs RV, earnings behavior, simulations — the full picture.
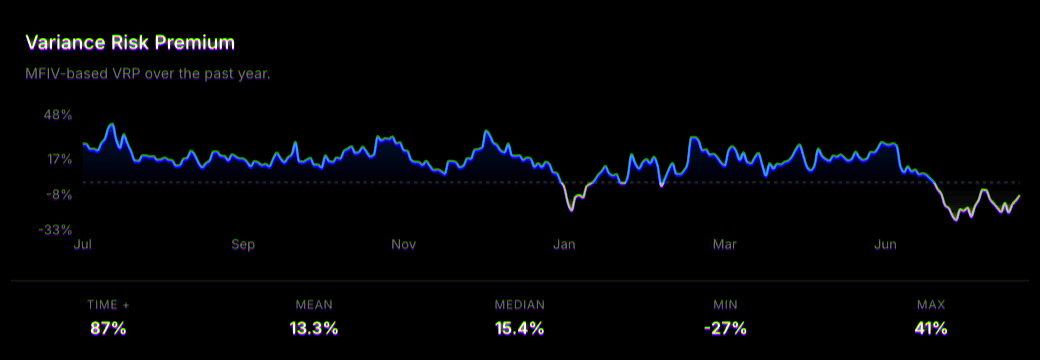
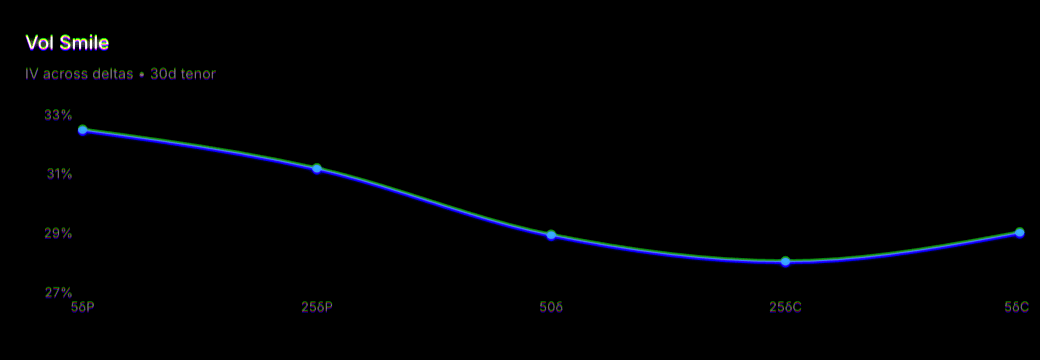
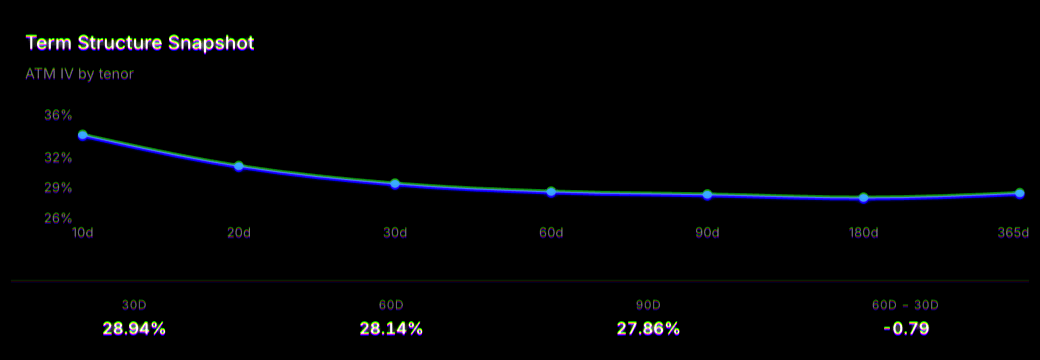
A structured decision framework for options sellers
Find the opportunity
Screen for stocks and ETFs where options may be richer than they deserve to be.
Evaluate setup quality
Analyze IV versus realized movement, skew, term structure, relative value, and earnings behavior to judge whether the setup is actually attractive.
Check market context
Check the variance risk premium and broader volatility conditions to see whether the environment supports the trade.
Structure the trade
Use the data to choose the trade structure that best fits the setup and your risk tolerance.
Simulate risk and sizing
Run Monte Carlo and scenario tools to understand payoff distribution, edge, and position size before entry.
Monitor trades and performance
Track catalysts, open positions, and account performance so your process stays consistent over time.
Find the opportunity
Screen for stocks and ETFs where options may be richer than they deserve to be.
Evaluate setup quality
Analyze IV versus realized movement, skew, term structure, relative value, and earnings behavior to judge whether the setup is actually attractive.
Check market context
Check the variance risk premium and broader volatility conditions to see whether the environment supports the trade.
Structure the trade
Use the data to choose the trade structure that best fits the setup and your risk tolerance.
Simulate risk and sizing
Run Monte Carlo and scenario tools to understand payoff distribution, edge, and position size before entry.
Monitor trades and performance
Track catalysts, open positions, and account performance so your process stays consistent over time.
Built for traders who want a systematic approach to the variance risk premium
Best fit
- Traders looking for short volatility setups
- Short strangle / short straddle traders
- Traders who want a structured volatility workflow
- Retail traders focused on risk management and process
Probably not for
- Day traders looking for chatroom alerts
- Traders who want quick signals without analysis
- Traders who prefer guessing over structured data
Pricing at launch
VOLARB isn’t open yet. Join the waitlist and you’ll hear the pricing before anyone else.
The full platform
Everything below, in one place, from day one.
- Volatility screeners for options setups
- IV, HV, skew, and term structure analytics
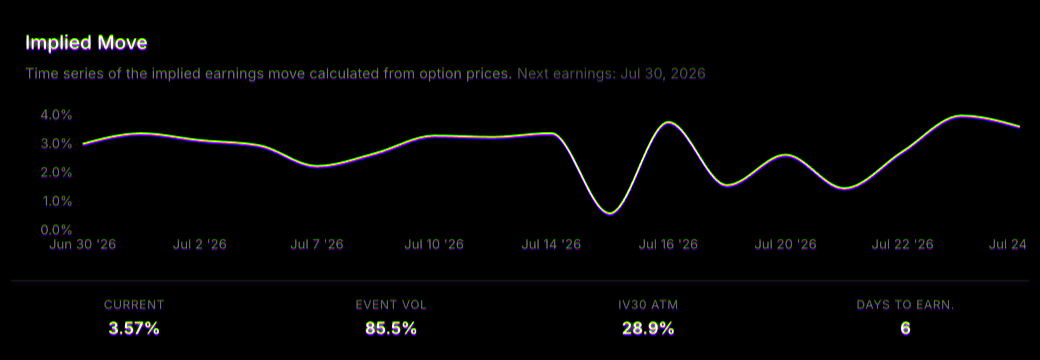
- Earnings move and implied vs realized stats
- Monte Carlo simulation and Kelly position sizing
- Trade tracking and event calendar
No card, no commitment — just an email so we can tell you when it opens.
Frequently asked questions
What to know before getting started
VOLARB is a volatility analytics platform for options sellers. Screen the market for premium-selling setups, analyze any ticker’s volatility in depth, simulate the trade before you place it, and manage the position after — one structured workflow instead of a pile of spreadsheets and gut feel.
Traders who sell options premium — strangles, straddles, credit spreads, the wheel — and want a data-driven process. If you’d rather judge a trade by implied-versus-realized volatility than by an alert in a chatroom, this is for you.
Alert services hand you picks. VOLARB hands you a process: research-based screens surface candidates, then the analytics — implied vs. realized vol, term structure, skew, earnings history — let you judge whether premium is actually mispriced before you commit. No signals, no hype, no chatroom theatrics.
Volatility metrics update end-of-day from institutional market data providers. That’s deliberate: the edges VOLARB targets — variance risk premium, term-structure dislocations, earnings mispricing — are structural, not tick-by-tick. You’re making decisions about the next weeks, not the next minute.
You should understand the basics — what a strangle is, what implied volatility means. Beyond that, every metric in the platform ships with a plain-English explainer built in, so you learn the framework as you use it.
Yes. Monte Carlo simulation shows you the full P/L distribution of a position before you place it, with Kelly-based sizing, VaR and CVaR per contract, and probability of profit — so size is a calculation, not a guess.
Not yet — VOLARB is still in private development and isn’t taking new accounts. You can join the waitlist, and we’ll email you as soon as that changes. Waitlist members hear the launch pricing before it goes public, and get the weekly volatility letter in the meantime.
Still have questions? Contact support
Weekly volatility notes and trade setups
Get weekly trade ideas from our screeners, volatility research, and updates on new tools and features.